Inference Performance
What MemKV does to time-to-first-token and served throughput under a production-shaped agentic workload — eight models from 8B to 405B, 198 measured windows on 8× H200, with the below-cliff cost published alongside the above-cliff gain — plus the Nemotron-3 Ultra interactivity frontier (tok/s/GPU vs tokens/s/user).
What this page measures
This page measures what MemKV buys an inference server: time-to-first-token (TTFT) and served throughput, with MemKV attached to vLLM as a KV offload tier.
The benchmarks page measures the wire instead — how fast bytes move between a client and MemKV, including under-load transport from this same campaign.
How we measure
Most published KV-cache numbers come from the measurement that flatters a cache most: a fixed-length context, a guaranteed hit, cold prefill in the denominator. That measures the cache's ceiling, not its production value.
The numbers on this page come from NVIDIA AIPerf's agentic-code workload instead: 1,000 synthetic coding-agent sessions with real think time (70% rapid agent steps ~2.5 s, 30% human pauses ~40 s), contexts growing to 124k tokens, replayed at concurrency 8 → 256 with the engine's own prefix cache on — so MemKV only earns credit for reuse the GPU genuinely cannot hold.
Campaign configuration
Every window in the sweep ran with these settings. Per-cell counts, intervals, and raw windows live in the campaign dataset, which is held with the campaign rather than published alongside these docs.
| Setting | Value |
|---|---|
| Workload | NVIDIA AIPerf agentic-code trace, 1,000 synthetic coding-agent sessions |
| Think time | 70% agent steps ~2.5 s, 30% human pauses ~40 s |
| Context growth | up to 124k tokens per session |
| Concurrency ladder | 8 → 256, one window per rung |
| Trace | one seed, replayed identically for every model and both arms |
| Window | 600 s, first 180 s trimmed so both arms are compared in steady state |
| Engine | stock vLLM v0.27.1 through the upstream OffloadingConnector API |
| Engine prefix cache | on, in both arms |
| Store policy | write-through inside every measured window — no excluded population pass |
| GPUs | 8× H200, per-model tensor parallelism (see the results table) |
| MemKV fleet | 2 storage nodes, 48 raw NVMe, 2× 400 GbE rails |
| Coverage | eight models from 8B to 405B, 198 measured windows |
| Statistics | P90 over continuing turns, 50–408 turns per cell; bootstrap 90% CI per cell, bounds in the dataset |
| Work-parity control | completed turns vs baseline, next to every latency ratio |
The results table marks the rows whose confidence intervals do not overlap the baseline's. We report P90 rather than P99: at 50–408 turns per cell a P99 rests on the top one to five observations, so it reports the maximum rather than the tail.
Results by model
Verified August 2026.
| Model | TP | Continuing-turn P90 TTFT | Throughput / work completed |
|---|---|---|---|
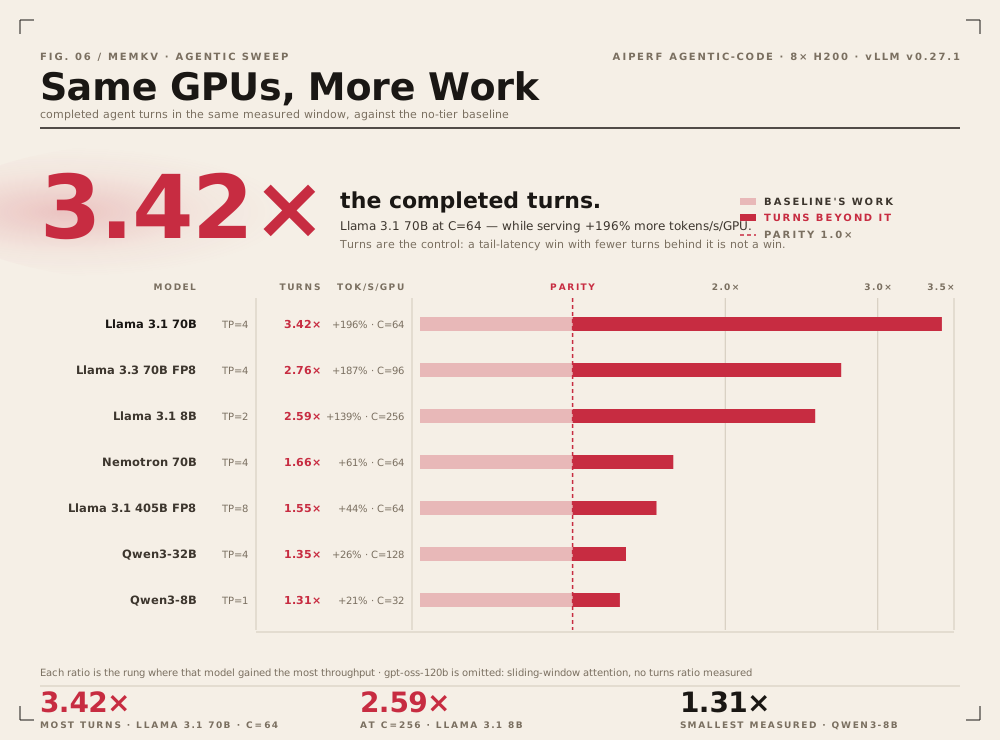
| Qwen3-32B | 4 | 4.5× (51.7 s → 11.5 s, C=128, CIs separated) | +26% tok/s/GPU, 1.35× turns in the same window |
| Llama 3.1 8B | 2 | 2.9× (25.5 s → 8.8 s, C=64, CIs separated) | +139% tok/s/GPU at C=256, 2.59× turns |
| Llama 3.3 70B FP8 | 4 | 3.2× (C=64) | +187% at C=96, 2.76× turns |
| Llama 3.1 70B | 4 | 1.9× (C=256) | +196% at C=64, 3.42× turns |
| Llama 3.1 405B FP8 | 8 | 2.0× (C=96, CIs separated) | +44% at C=64, 1.55× turns |
| Nemotron 70B | 4 | 1.5× (C=64) | +61% at C=64, 1.66× turns |
| Qwen3-8B | 1 | 2.8× (C=64, CIs separated) | +21% at C=32, 1.31× turns |
| gpt-oss-120b | 1 | inconclusive — see below | +8% at C=256 |
The work-parity control
A cache that slows the engine gets offered less load, and less load shortens tails by itself — so every latency ratio above is reported next to the turns the same window completed. Those ratios are the chart below: the pale bar is the work the baseline also did, the solid bar is what the tier added on top.
Interactivity — throughput per GPU against per-user speed
TTFT and completed turns are two ways to read the sweep. A third plots served tokens/s/GPU against per-user speed — the median decode rate one request sees, which is one divided by its inter-token latency (ITL). Each arm is swept across closed-loop concurrency, so load rises from right to left, and up and to the right is better. SemiAnalysis InferenceX popularized this view.
These series come from a companion study on Nemotron-3 Ultra (550B/A55B FP8), not from the eight-model sweep above. It ran on the same 8× H200 and dual-rail MemKV platform, but at human pacing: every inter-turn delay is 30–60 s, slower than the agentic trace. It compares three arms — stock vLLM, LMCache MP with a DRAM L1 only, and native offload backed by MemKV.
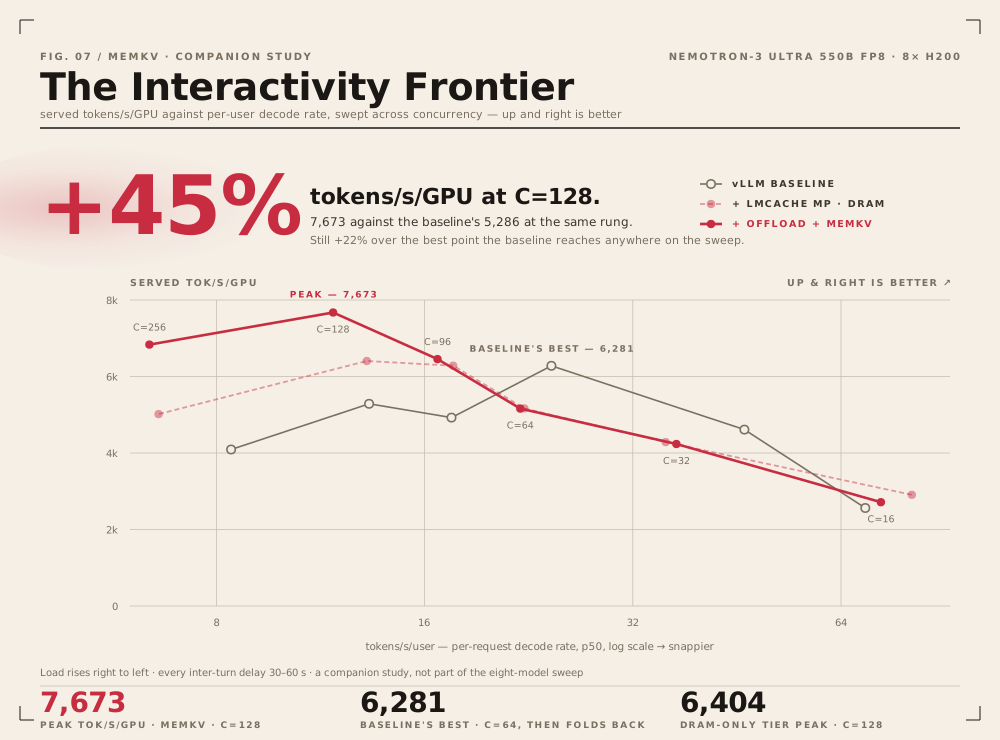
The baseline peaks at 6,281 tok/s/GPU at C=64, then folds back to 4,092 as recompute takes over. The MemKV arm keeps climbing to 7,673 at C=128 — 45% above the baseline at that rung, and 22% above the best point the baseline reaches anywhere on the sweep. The DRAM-only arm clears the cliff too, but it tops out at 6,404 and falls away past C=128, the point where MemKV's NVMe tier starts returning what DRAM alone can no longer hold.
| tokens/s/user (p50) / served tokens/s/GPU | C=16 | C=32 | C=64 | C=96 | C=128 | C=256 |
|---|---|---|---|---|---|---|
| vLLM baseline | 69.4 / 2,561 | 46.4 / 4,612 | 24.4 / 6,281 | 17.5 / 4,925 | 13.3 / 5,286 | 8.4 / 4,092 |
| vLLM + LMCache MP (DRAM L1) | 81.0 / 2,908 | 35.7 / 4,286 | 22.3 / 5,166 | 17.6 / 6,282 | 13.2 / 6,404 | 6.6 / 5,017 |
| vLLM + native offload + MemKV | 73.1 / 2,714 | 37.0 / 4,236 | 22.0 / 5,162 | 16.7 / 6,456 | 11.8 / 7,673 | 6.4 / 6,833 |
Compare the arms at matched interactivity. Near 17 tokens/s/user both cache arms serve 28–31% more per GPU than the baseline; near 13, the DRAM-only arm adds 21% and MemKV 45%. Neither tier is free before eviction starts: at C=32 and C=64 both give up 7–18% of baseline throughput. At C=16 the load is light enough that neither does.
The capacity cliff — both halves
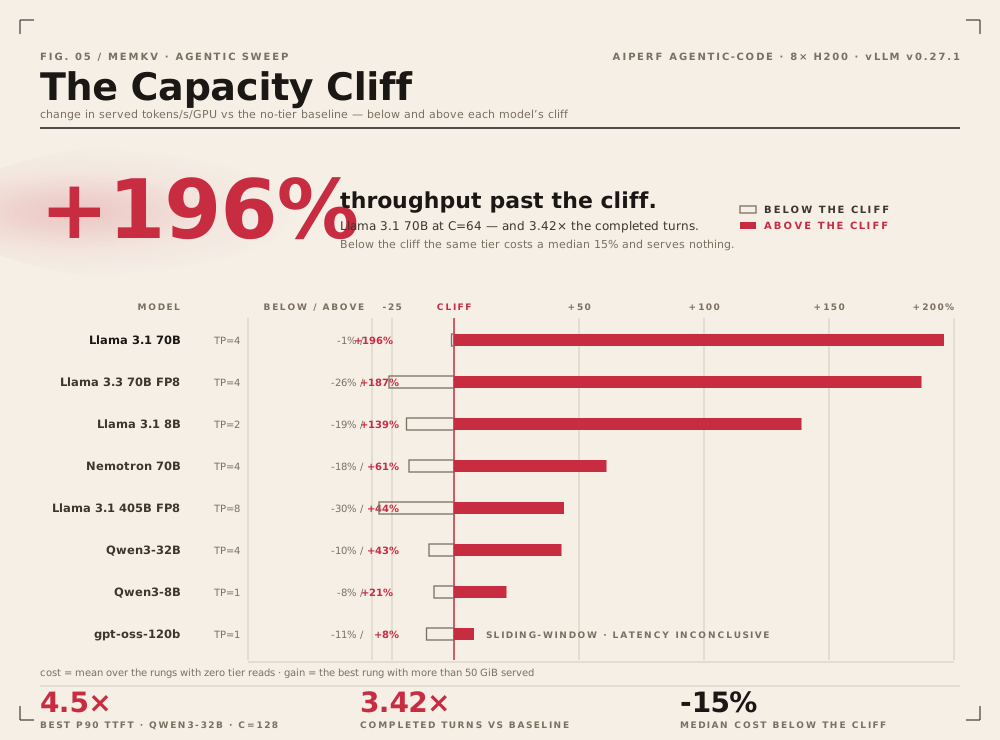
The pattern is a step function, and the chart at the top of this page publishes both halves. They are measured the same way for every model: the cost is the mean over the concurrency rungs where the tier logged zero reads, and the gain is the best rung where it served more than 50 GiB.
Below the cliff — the point where a model's live KV working set exceeds HBM — a write-through tier costs throughput: a median of −15% across the eight models, up to −30%. Every block is stored and nothing is ever read back, because the GPU still holds everything the workload asks for.
Above the cliff, the baseline collapses into re-prefilling evicted contexts while MemKV keeps the GPUs decoding. On Llama 3.1 8B the no-tier baseline folds back to 11,345 tok/s/GPU at C=256 while the MemKV arm climbs to 27,134 tok/s/GPU (+139%) and completes 2.59× the turns.
The crossover is computable before you deploy: KV bytes/token × concurrency × context length, against the HBM left after weights. Enabling the tier is a sizing decision, not a leap of faith — see KV cache sizing.
Unlike ceiling measurements, these figures include the cost of populating the tier. Stores run write-through inside every measured window, so there is no excluded warm-up pass — only a 180 s steady-state trim, applied identically to every arm.
The fixed-context ceiling
The other measurement shape — one request at a time, a fixed-length context, a guaranteed hit against cold prefill — answers a different question: how fast the tier serves KV when nothing contends for it. Measured that way, MemKV reaches 20.5× P99 TTFT on H100 (24k contexts, output-validated) and 15.9–55.7× on AMD MI300X at long contexts.
Those hold under the conditions stated, and they describe the ceiling rather than the behavior under load: every request hits, nothing queues, and there is no think time. Read them alongside the agentic results above, not in place of them.
Where MemKV does not help
- Workloads with almost no prefix reuse. There is nothing to serve back.
- Models whose working set never outgrows HBM at your concurrency. They pay the write-through cost for nothing. Size the deployment first.
- Sliding-window-attention models. They cache poorly by construction. On gpt-oss-120b, half the KV is window-limited, tier reads run about 10× lower than on dense peers, and the results are statistically inconclusive — which is what we report.
The wins come from prefix-reuse traffic past the capacity cliff: long shared system prompts, RAG over large documents, multi-turn agents, and batch evaluation over shared context.